$ES Weekly Plan - 9th Mar'26
Sellers in Control. Buyers have their work cut out.


🚀Live. Full Throttle. Let’s Roll
EdgebyRS Discord is open again.
If you want real time guidance, live reads of developing structure, and clarity on what each move means —> this is your window.
The room is active. The work is sharp. Step in and level up. 💪
📅ES Weekly Reflective Study
https://x.com/EdgebyRS/status/2030381120022557091
🧭 Market Structure Overview
Daily: OTFD (Ends 6,780)
Weekly: OTFD (Ends 6,911)
Monthly: OTFD: 3M Balance Breakdown active
What Happened Last Week
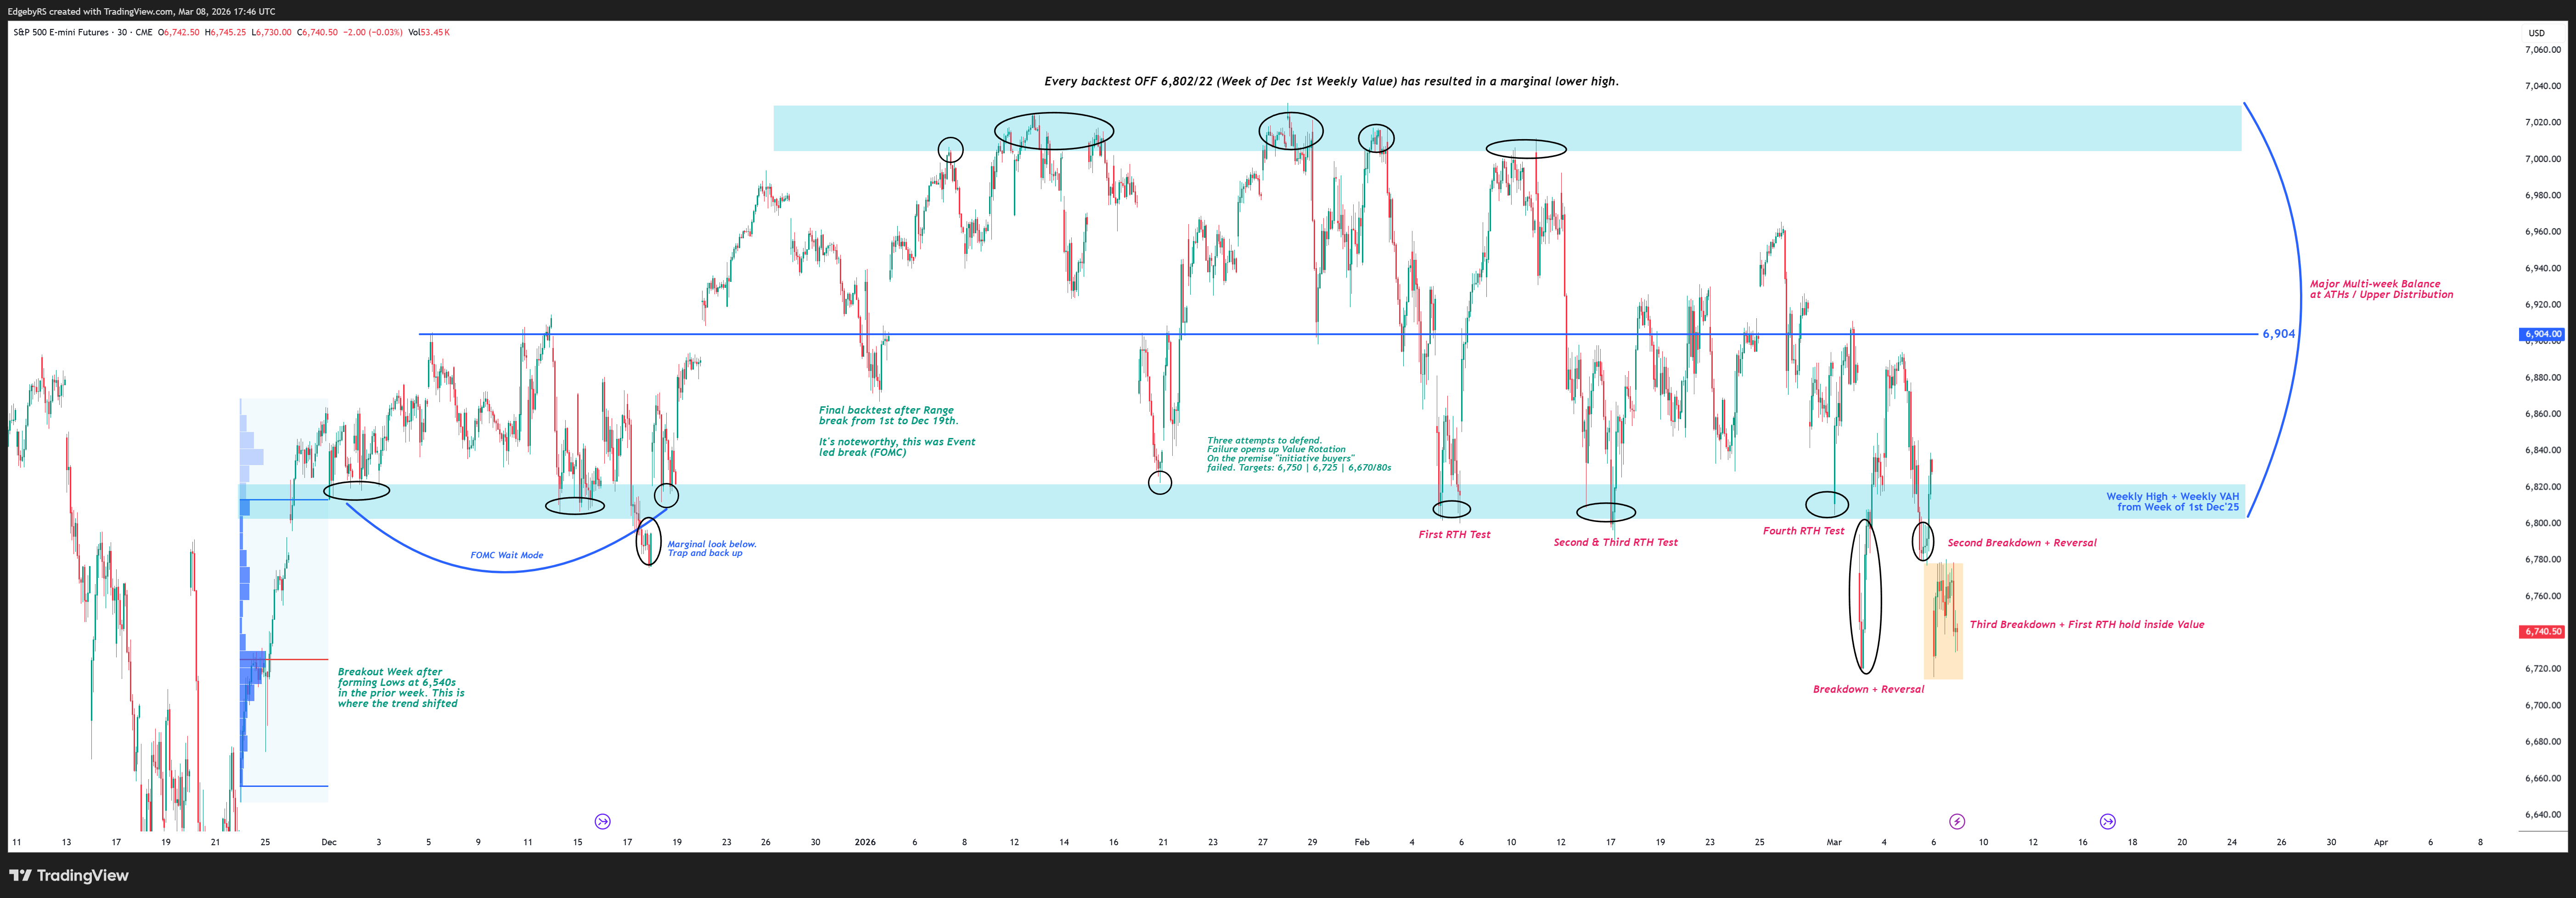
ES opened the week at Balance Top 6,808, rallied into Weekly VAH at 6,910, and then found responsive sellers that ultimately pushed the auction to new weekly lows at 6,716. Buyers did respond on the first test at 6,724 (Dec NVPOC + Weekly Support), but failed to sustain bids above Weekly Value (6,842) and the broader Balance range (6,592–6,808). As a result, ES closed the week back inside Balance for the first time in three months.
The most notable development occurred on Tuesday when buyers defended 6,724/32. That defence found resistance at 6,887/92 (Weekly Pivot) and printed a lower high for the week despite the earlier lower low. This confirmed seller presence and initiated the rotation lower that ultimately led to the breakdown of prior week’s value. Although the second test of 6,724 found support again, ES still marked its first close back inside Balance and did so near session lows.
Structural Outcome & Way Forward
The midweek failed breakout attempt of the Balance range (6,592–6,808) has shifted the dynamics toward higher timeframe sellers. Typically, such failures lead to a full rotation across the Balance range toward 6,592. However, Tuesday’s session established a demand zone at Weekly Support 6,724, which held again during Friday’s retest.
Friday’s event driven session failed to accelerate below Tuesday’s low at 6,719 but still produced a lower high while building value inside Balance (6,592–6,808). Importantly, this marked the first RTH session to establish value within the balance after three months of trading above it. In addition, ES sustained below prior week’s VAL, shifting immediate control toward sellers. This development is particularly meaningful because it comes after the failed breakout attempt earlier in the week and continues the pattern of weekly value migrating lower for a third consecutive week.
The coming week will focus on whether sellers can capitalize on Friday’s developing weakness or whether buyers step in above Friday’s high to reclaim 6,808 and squeeze late sellers. Sellers must now validate the developing weakness by achieving sustained acceptance below 6,718/24, which would open the door toward 6,672/86, 6,625/46, and ultimately 6,591/6,611. Note: Sustained acceptance would be on either a Gap that holds or in the event any Gap is seen post inventory correction.
Failure to achieve acceptance below that region, or a quick reclaim of Friday’s VAH at 6,777 followed by 6,808, would rotate ES back toward 6,842 and 6,887/94 where the next directional decision is likely to unfold. Any sustained move higher would likely require headline driven acceptance above 6,808.
The structural shift has now occurred. The next two to three sessions will determine whether the breakdown gains traction. In accordance with Balance Rules, a full rotation across Balance (6,592–6,808) cannot be ruled out.
As noted in earlier weekly plans, we continue to support the view of a projected move of 216–234 points. With the recent breakdown of the three month balance, that target aligns with both Balance Low and the Single Prints near 6,592. Early clues of weakness emerge on sustained acceptance below 6,718–24, while strength remains defined above 6,797–6,808. Any form of breakdown failure within this balance will likely be characterized by London range migration, value migration, opening drive behaviour, OTF development, or a gap open.
What Else Matters
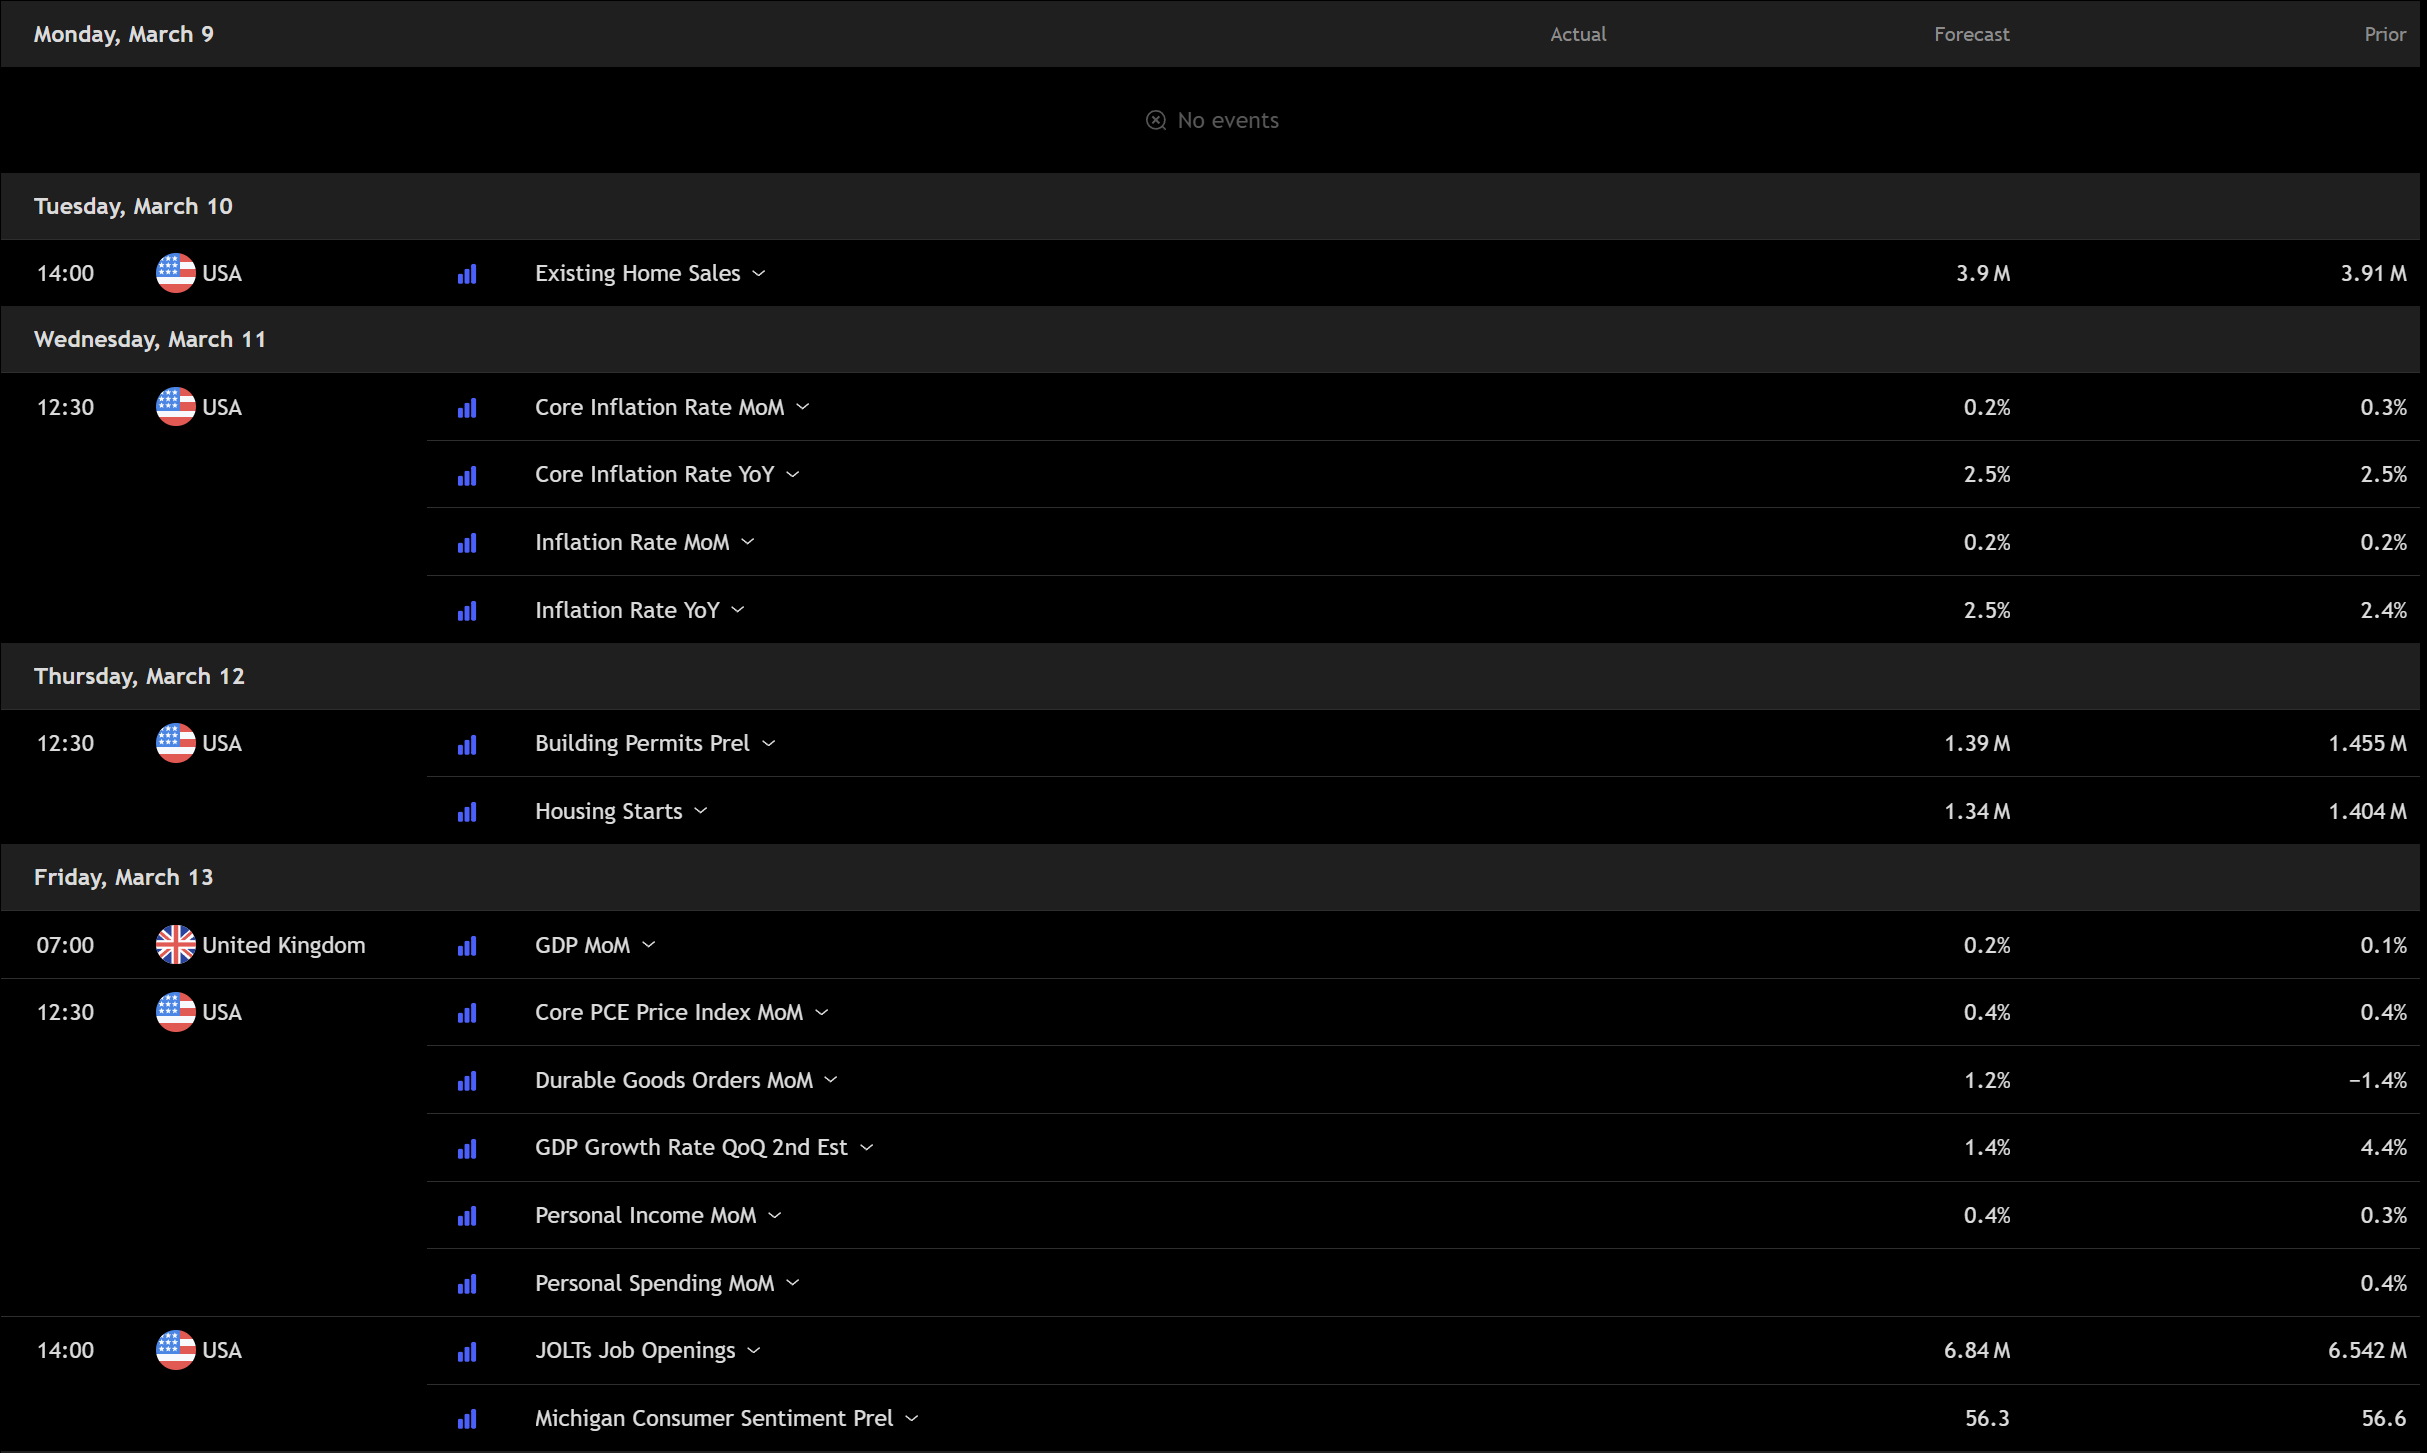
Two primary economic events are scheduled this week: CPI on Wednesday and PCE on Friday. Until those catalysts arrive, ES is likely to be guided by Friday’s edges, which carry strong confluence and should define the intraweek directional move. It is also important to remain aware that geopolitical developments may introduce additional volatility around key levels.
For the week ahead, the auction will primarily be governed by:
• Weakness Below: 6,718 - 6,724
• Structural Repair Above: 6,797 - 6,808
Upside Targets:
6,842 → 6,887 → 6,924
Downside Targets:
6,677 → 6,624 → 6,592 → 6,555
📖 Weekly Plan
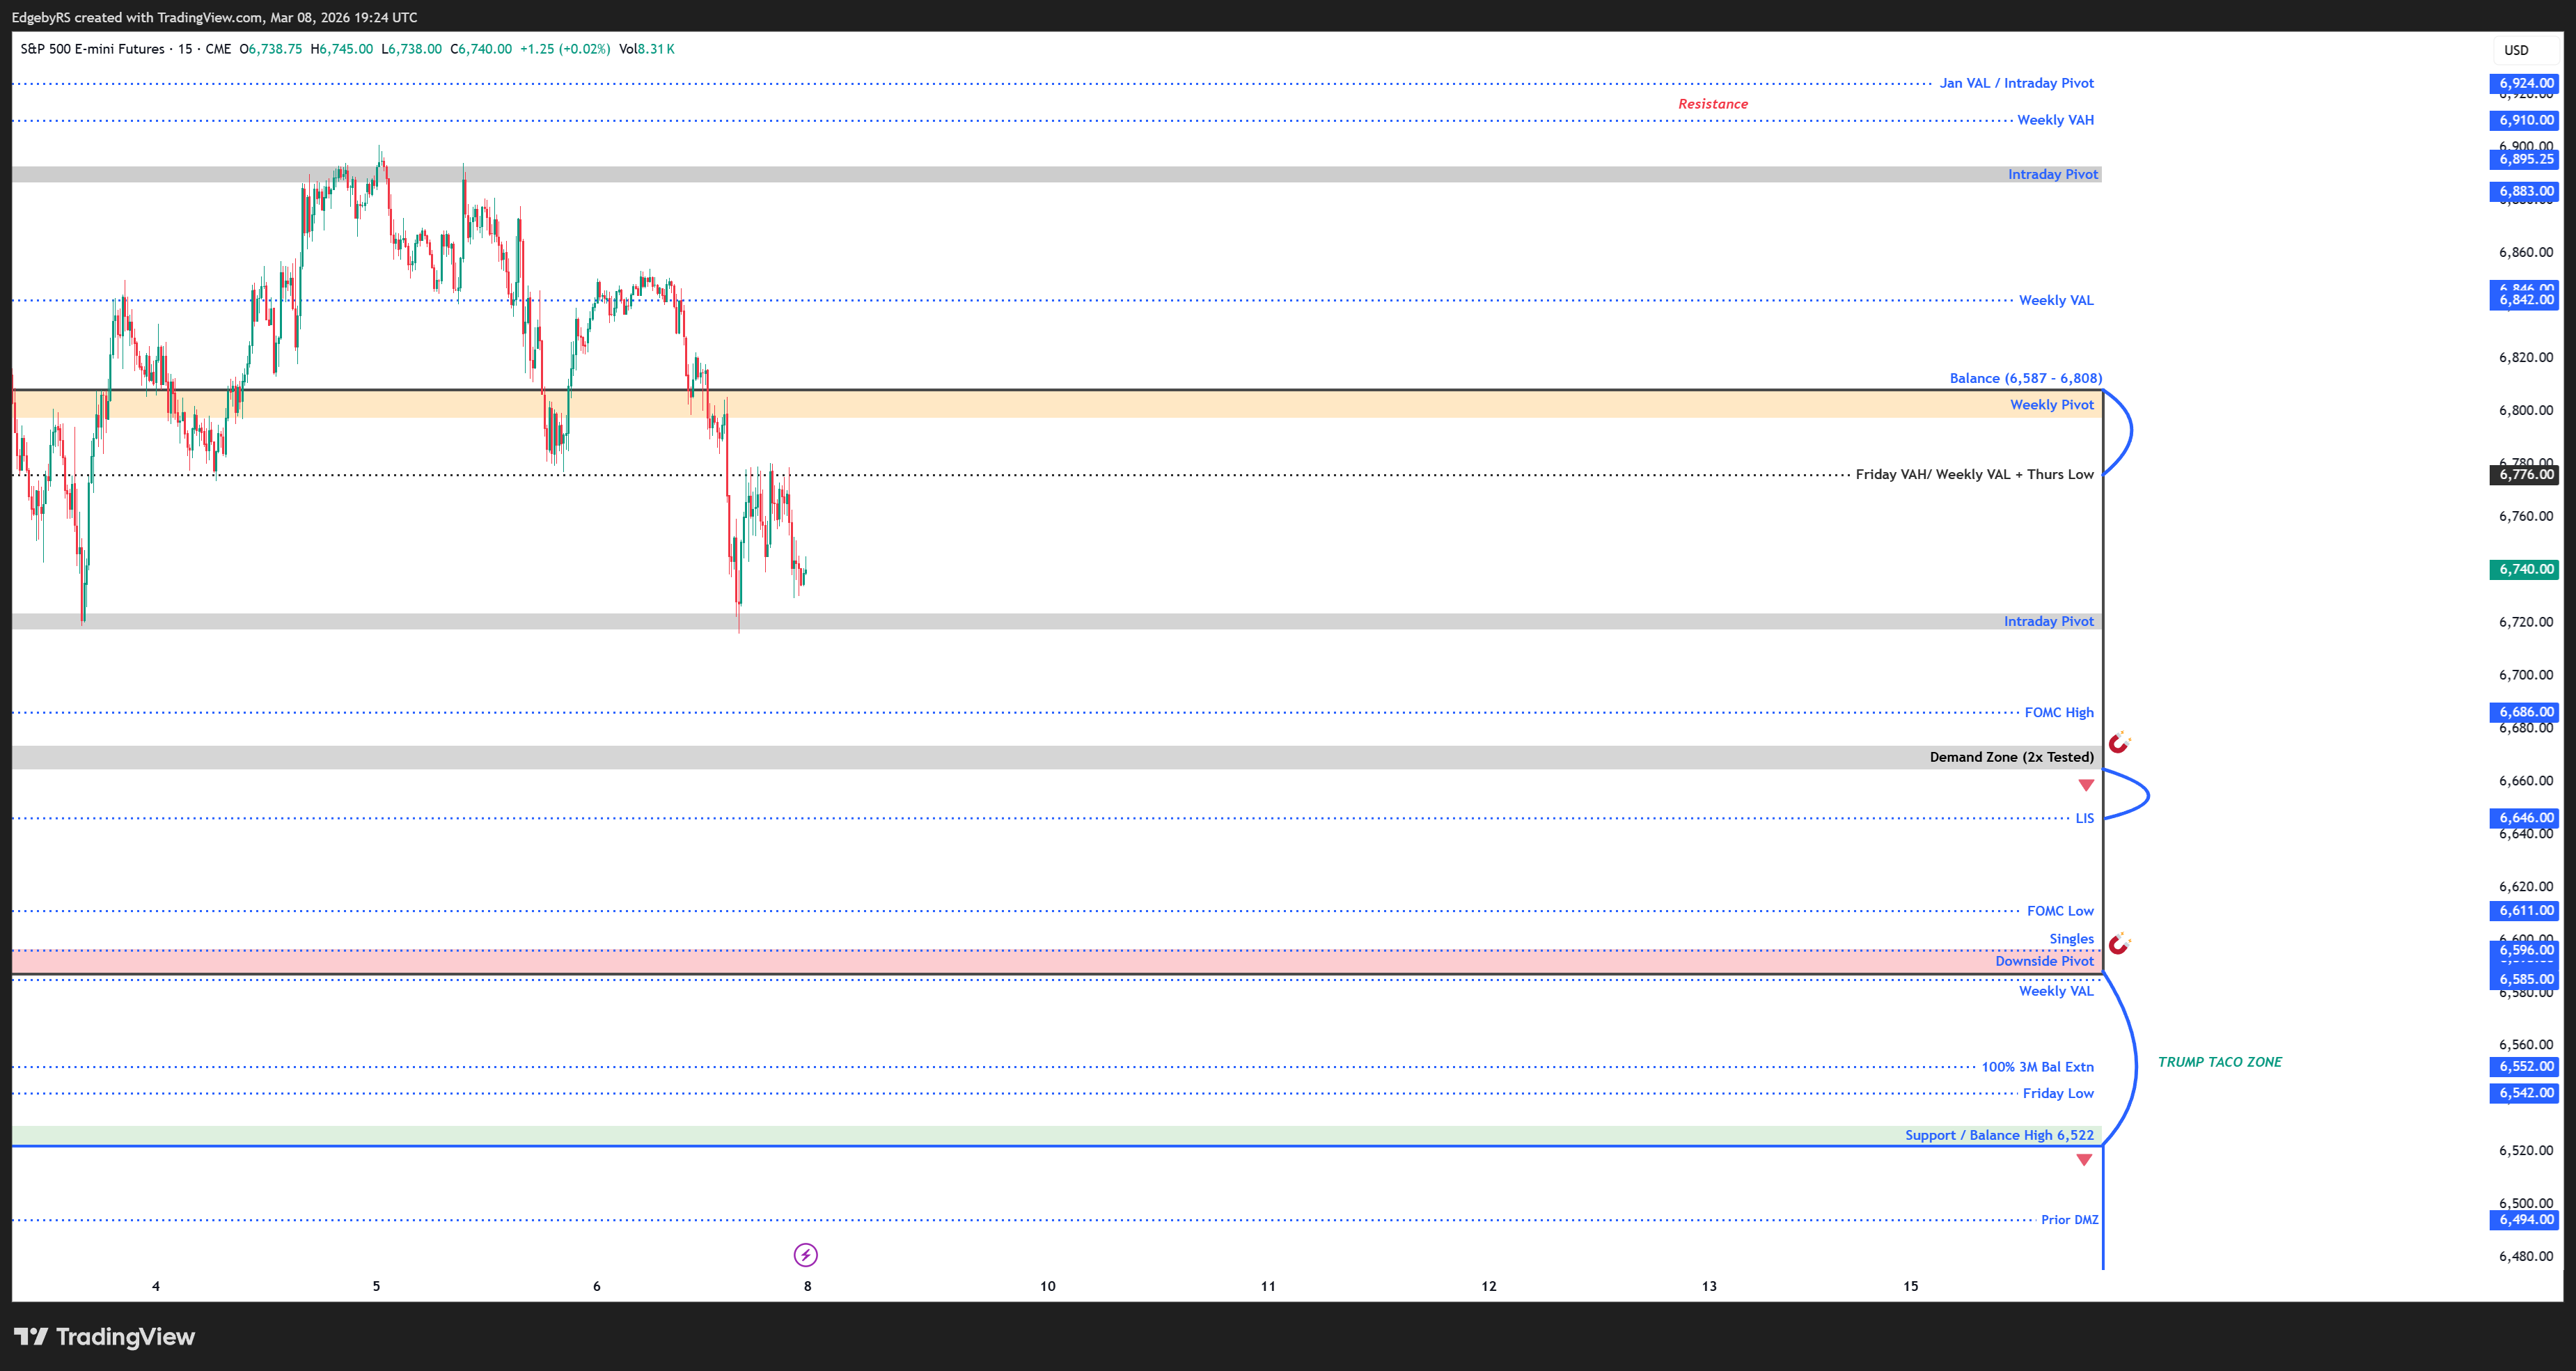
🎯 Weekly Pivot (WP): 6,797 – 6,808
This zone aligns with:
NFP Release High
Balance Top
Monday’s Low (Session that printed Highs of the Week)
📌 Buyer Playbook
6,797 - 6,808 (Weekly Pivot)
Reclaiming the Weekly Pivot (WP) puts ES above Friday’s VAH and must be validated at 6,837, then initiates V-shaped recovery targets:
6,887/94 (Intraday Pivot)
6,910/24 (Last Week’s High + JAN VAL)
6,972/77 (Event Low + Upside Pivot, Structural Shift)
Upside Pivot must reclaim LIS 6,992 to validate initiative buyers
Further upside initiates on acceptance above 6,972/77-92 (Structural Shift)
7,037/47 (ETH ATH, Watch for Excess post clean up)
7,077/86 → 7,108 (Minor Resistance + LIS)
7,134/54 (Resistance/ Exhaustion)
💡Pro Tip:
Chop at Weekly Pivot can be expected. Any breakout attempt on Gap or OTFU will validate buyers strength.
📐 Rotational Playbook
Lack of traction above Friday’s high/VAH or a look above and fail triggers a rotation lower targets:
6,747 (Friday’s VAL)
6,718/24 (Weekly Low)
6,672/86 (Demand Zone)
6,646 (LIS)
6,587/6,611 (Singles + FOMC Low + Balance Low)
💡Pro Tip:
Sharp rallies can be expected as ES tests the lower levels for the first time in three months. It is important to observe whether such rallies reclaim key structural levels such as 6,718/24 or 6,797–6,808. Failure to do so would likely result in the sell the rip continuing. It is also worth noting that at 6,655, ES would complete the value rotation of the 25th Nov’25 Breakout Week Value (6,655–6,814).
📉 Seller Playbook
Buyers may attempt one more defence at 6,587/6,597 and must reclaim 6,646 or else weakness continues. Failure unlocks downside move targets;
6,572 (Dec Low + Holiday season launchpad, watch look below and fail)
6,542/55 (ESZ RTH Low + Support)
6,514/24 (ESZ Cont Low + 2nd Support)
💡Pro Tip:
Such a move would complete the backtests of all levels printed in Q4’25.
📘 Balance Rules
The extreme ends of a Balance act as support or resistance unless proven otherwise. In the event of a Balance Break, follow the trend and target 50% and then 100% of the range extension, unless there is a Look Above or Below and Fail, in which case the target shifts to the Balance Halfback and then the opposite extreme.
In the weekly charts below, we have highlighted the anchor balance ranges to monitor, which will help us better understand the weekly auction and rotation. Likewise, the zones, weekly support and resistance levels, and annotations highlight the key areas of interest.
Keep an eye out for a potential volatility trigger on Wednesday and Friday (CPI/PCE respectively) and continuing war headlines. We suggest maintaining prudence and situational awareness before initiating trades.
🗺️Weekly Zones
🧠RS Insights
Last week was a textbook breakdown of the multi-month balance, one we had anticipated given the repeated tests of the critical 6,800s region, where Balance Top and the breakout Weekly VAH from 25th Nov ’25 converged. Six separate tests of that area ultimately weakened the structure. The failure to reclaim Weekly Pivot 6,887/94 became the first major signal that buyers were losing traction, as multiple attempts to regain the level failed.
Friday’s event release then provided the final confirmation. ES backtested 6,804 from below, validating seller control and confirming acceptance back inside Balance (6,587–6,808). Once again, the zones were at the forefront guiding readers: Weekly Support 6,717/32 marked the weekly lows, while Weekly Pivot 6,887/94 effectively capped the highs throughout the week. The real standout was not merely the effectiveness of these levels, but the context that aligned each time.
Take Weekly Pivot as a case in point. Every bounce printed a lower high precisely at 6,887/94, including the recovery off Weekly Support 6,717/32. That repeated rejection confirmed persistent seller presence and showed that buyers from lower levels were unable to produce a higher high or shift the structure. Weekly Pivot now also aligns with this week’s Weekly VAH (6,896), reinforcing its importance.
The most important structural development is that ES has now closed the week inside Balance (6,587–6,808) and inside the breakout weekly value from the week of 25th Nov’25. This development occurred after two recent RTH backtests and a third attempt to explore lower. Buyers likely have one or two sessions at most to regain control. Otherwise, a full rotation of vAL 6,656 and balance low 6,587 becomes increasingly probable.
The first key observation remains straightforward: what happens at 6,717/24, and how the RTH session opens. Does ES gap down and fail? Does the session negate Friday’s close? Or does the market continue lower after failing to reclaim key levels outlined in the weekly plan? The answer will determine whether sellers maintain control from this region. The edge lies in combining higher-timeframe context with intraday MGI to understand how this balance rotation is preparing to resolve.
We are also introducing new downside targets as long as ES remains below 6,808: 6,542/55 and 6,514/24. Both levels marked important lows during RTH and London sessions in Q4’25 (ESZ contract), making them the next logical magnets. If ES manages to reclaim 6,808 with sustained strength, through OTFU, a gap higher, or the development of singles, these downside targets are likely postponed for the interim. Events will ultimately play a role in shaping the near term auction. Any positive geopolitical headline related to the ongoing conflict could trigger a sharp reversal.
Events + ETH Highs & its Nuance
Over the past several months our emphasis on events has proven both critical and profitable, and we will continue integrating events with market structure to guide our swing outlook. While recent months were dominated by economic releases and earnings, March has introduced three new catalysts that are comparatively rare: stress in private credit, surging oil prices, and the developing Iran conflict. These elements feed into one another, creating the conditions for a gradual and structured selloff.
Understanding credit and energy markets becomes important because shifts there often precede changes in sentiment. When sentiment eventually turns, it will likely appear through the auction first, then headlines and those shifts often align with key structural levels already outlined in the plan.
Three zones stand out in this context: 6,514/24, 6,542/55, and 6,592/6,611. Each has historically marked important turning points when negative headlines dominated the narrative. Previously the catalysts were FOMC decisions and the Trump trade war. The question now becomes whether we see a similar narrative shift, perhaps even a “Trump TACO” style pivot, around these levels. Time will tell, but the important point is knowing what to expect and where to watch for it.
Another nuance relates to the current high at 7,043, which was printed during ETH. Historically, such highs tend to precede roughly a~5% pullback before reversing back up. Given the current event driven environment, the correction could extend closer to the 7–9% pullback before a meaningful reversal develops. However, since much of the current selloff is tied to geopolitical developments, any shift in headlines becomes a key signal. Should that occur alongside reclaim of key structural levels, the resulting move would likely target at least the 6,910–6,924 region.
Why were we confident to Long at 6,717-32 and Short at 6,887/94?
The logic was simple. Weekly Support 6,717/32 was a critical region for two reasons: it aligned with Weekly NVPOC and the ESZ contract low. Structurally important levels frequently get revisited post contract rollovers, and we had identified weeks ago that 6,725 was likely to be tested during Q1’26. The first backtest therefore presented a high probability long, particularly as the session opened with a gap down directly into support. Even a conservative inventory correction from that location carried a minimum expectation of roughly +69 points.
The next opportunity emerged at Weekly Pivot 6,887/94. This zone marked the lower high across three consecutive sessions (Asia → London → RTH) and confirmed seller presence through the LIS Framework Short. When a +150 point rally off support fails to reclaim Weekly Pivot, it places a clear question mark on buyer strength. From that point, the downside rotation was the natural outcome.
Preparation mattered. And once again, it paid.
The plan outlines what the market is likely to do.
These insights exist to prepare, not to bias.
They sharpen awareness so that when the pattern truly emerges, execution is cleaner, confidence higher, and decisions grounded in structure over opinion.
Structure First. Levels Decide. Events Accelerate.
Economic Calendar
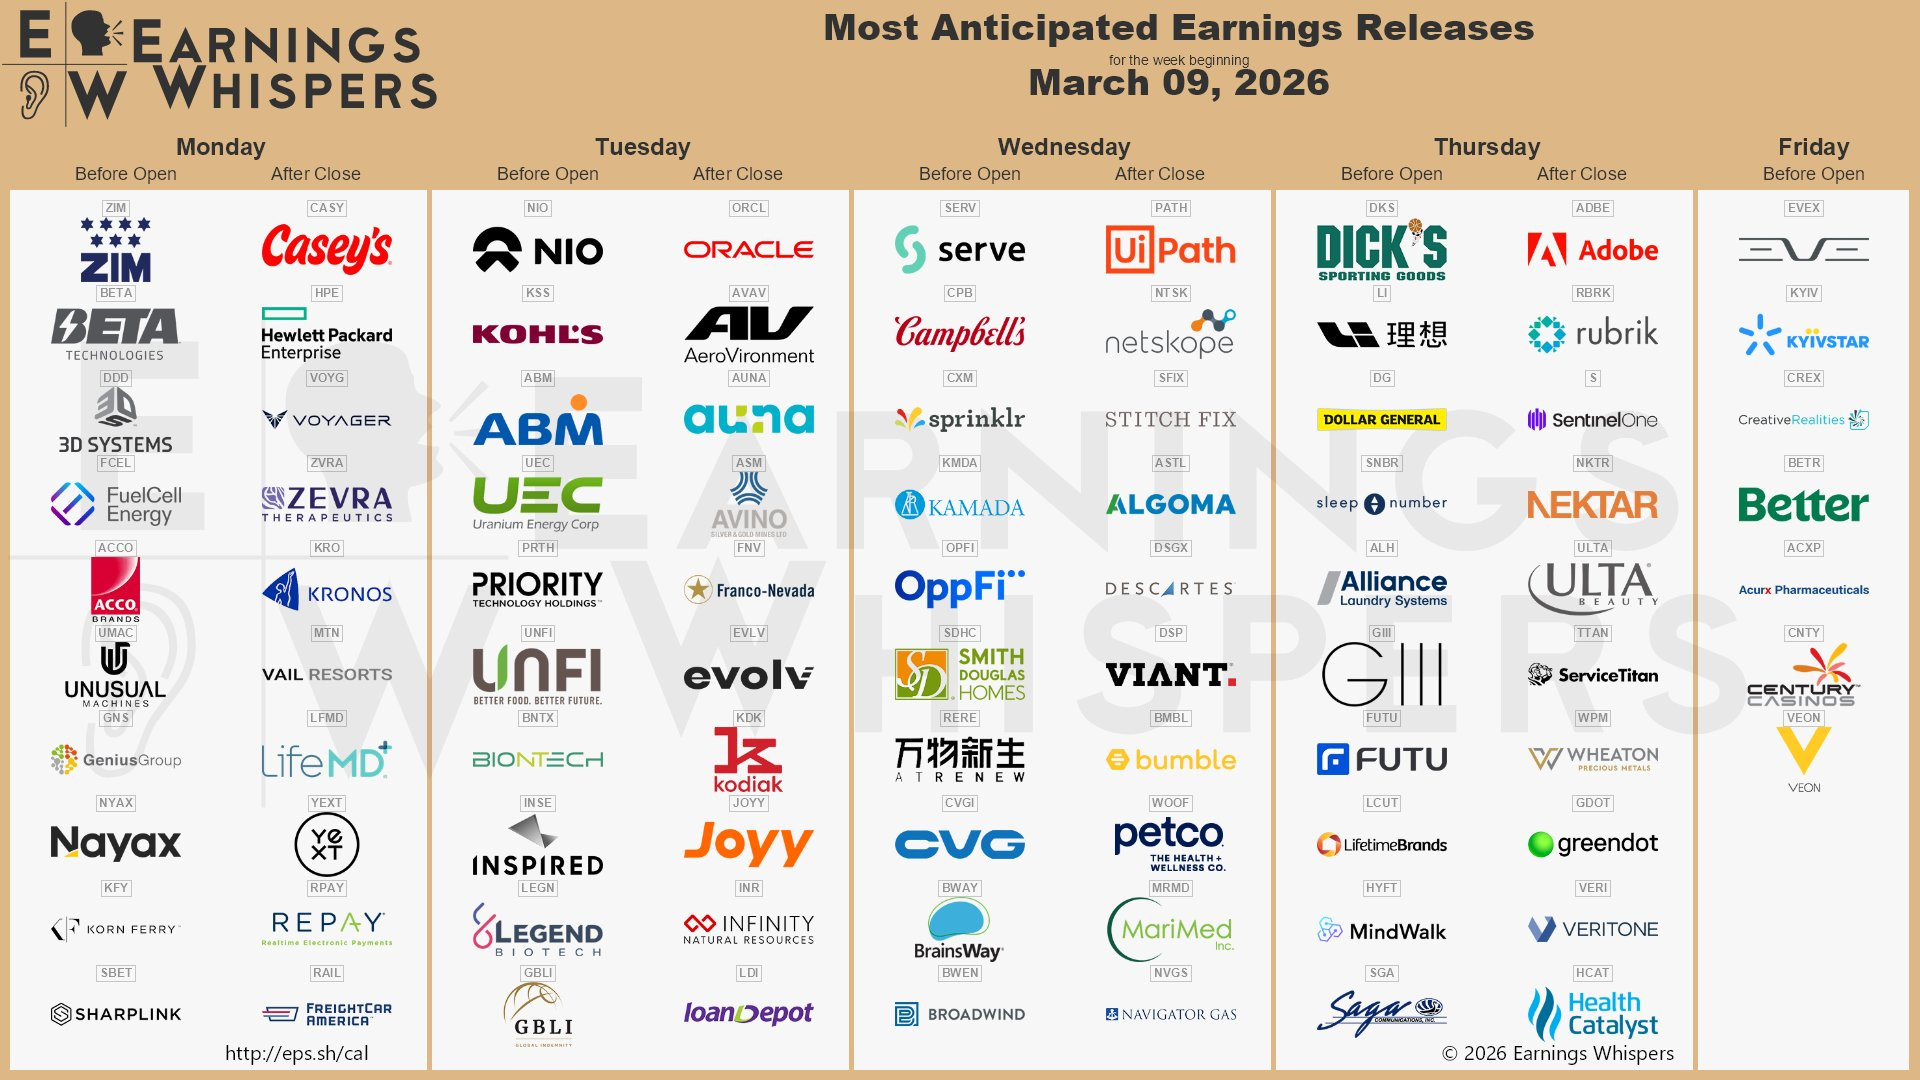
Earnings Calendar
Clarity First / Action Next.
Wish you all a fantastic week ahead! :)